
Figure 6.
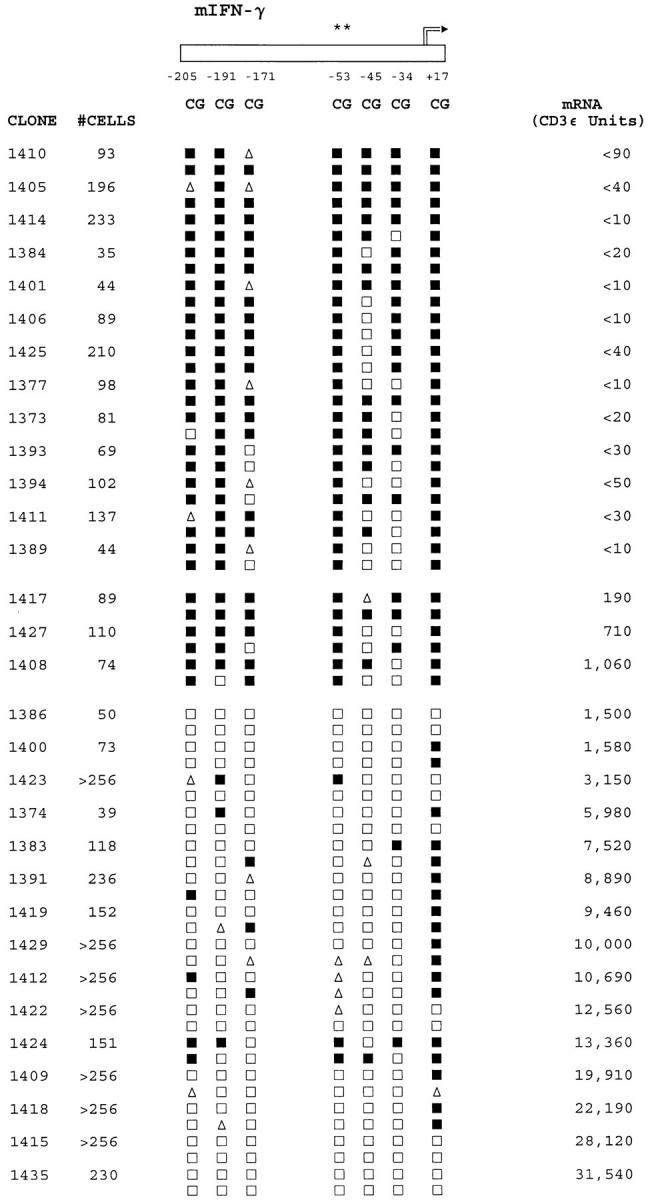
Regional IFN-γ promoter methylation patterns are related to IFN-γ mRNA expression levels in CD8+ T cells. Clone sizes and methylation patterns are shown as described in the legend to Fig. 4. Levels of mRNA are also shown as described in the legend to Fig. 5. The results depicted are representative of a panel of 40 clones for which complete DNA and mRNA data were obtained. Clones with undetectable mRNA levels are ranked by methylation pattern, whereas mRNA-positive clones are ranked by mRNA level.