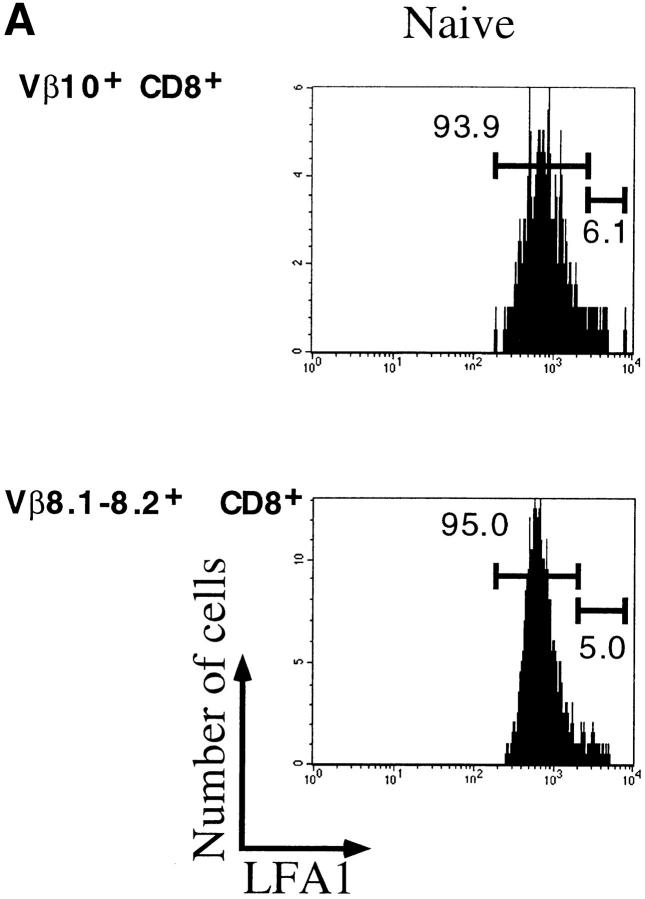
Figure 3.
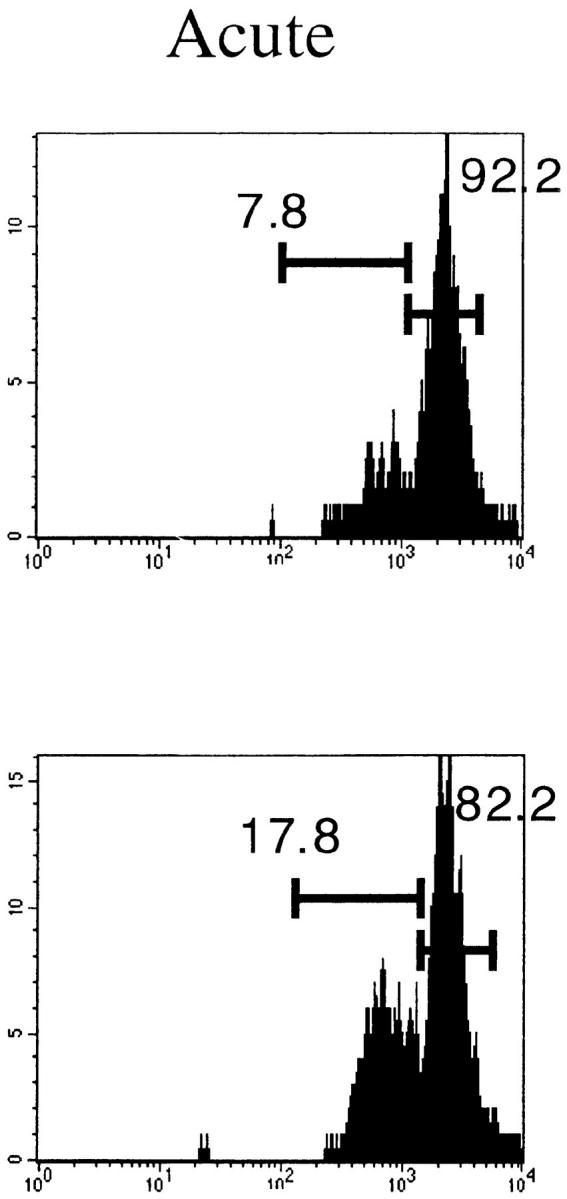
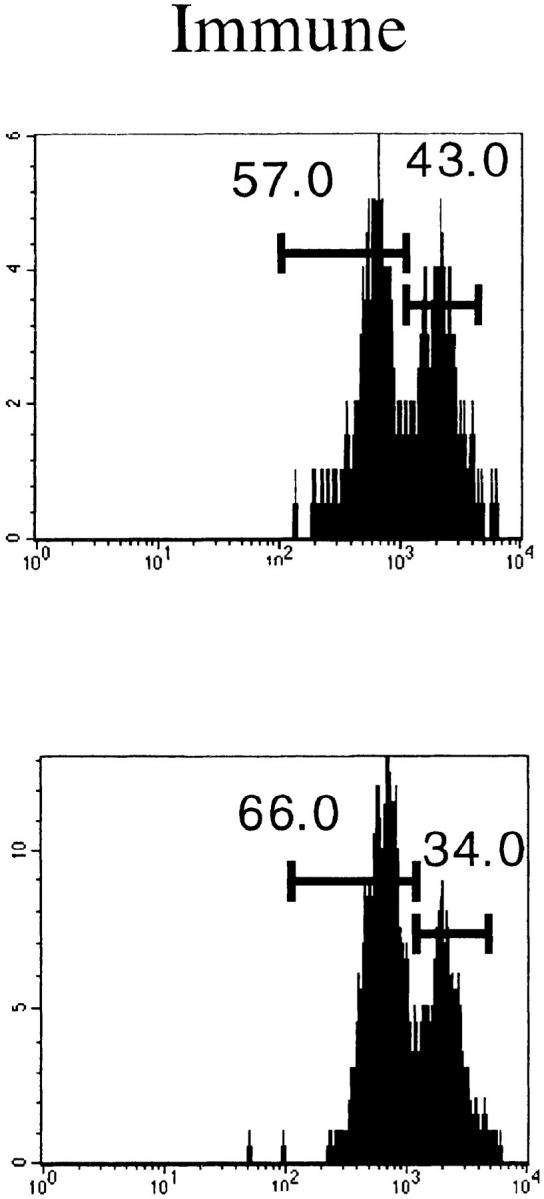
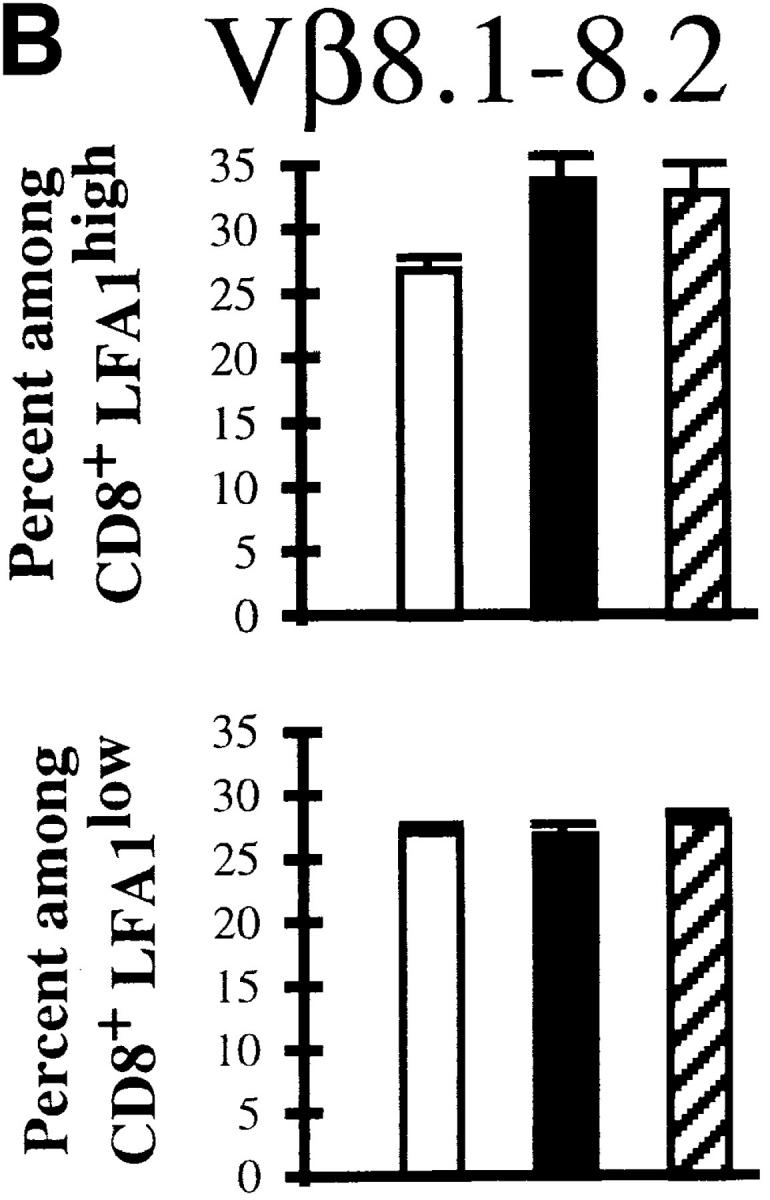
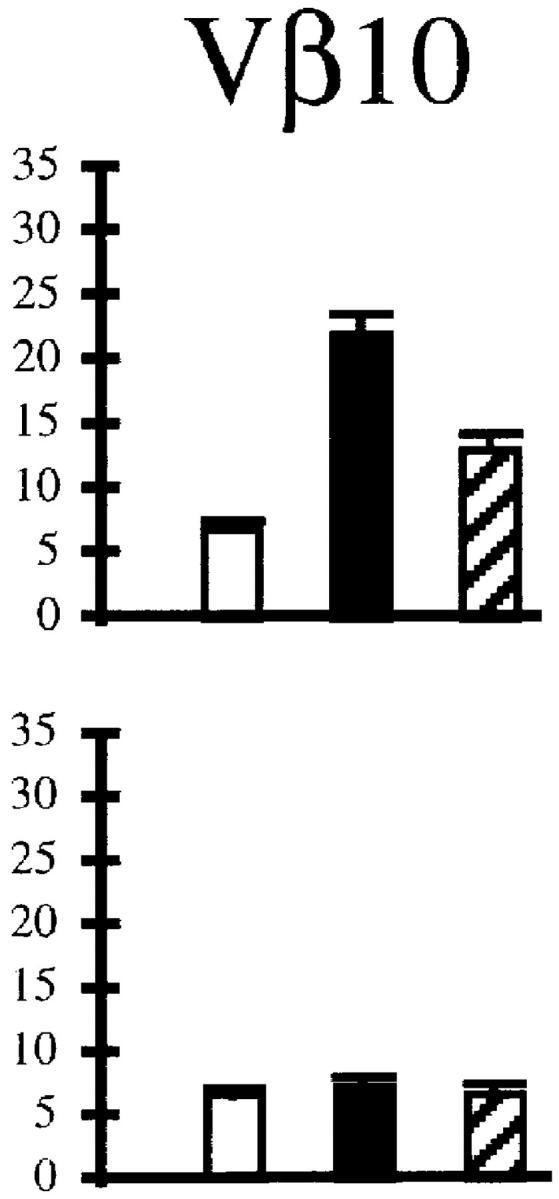
Activation status of Vβ10+ and Vβ8.1–8.2+ cells in naive, acute (day 8 after infection), and immune (>day 38 after infection) mice. (A) LFA1 analyses of CD8+Vβ10+ or CD8+Vβ8.1–8.2+ gated cells. All numbers are in percentage of gated cells. (B) Comparison of the frequencies of Vβ10+ and Vβ8.1–8.2+ cells among CD8+LFA1high and CD8+LFA1low cells. White bars, Naive; black bars, acute; striped bars, immune. The values plotted are averages ± SEs calculated from seven mice.

