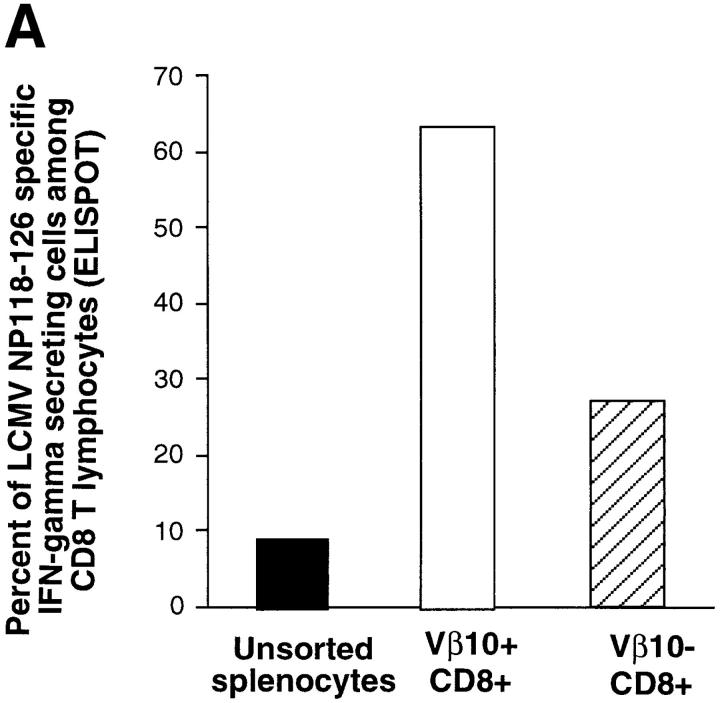
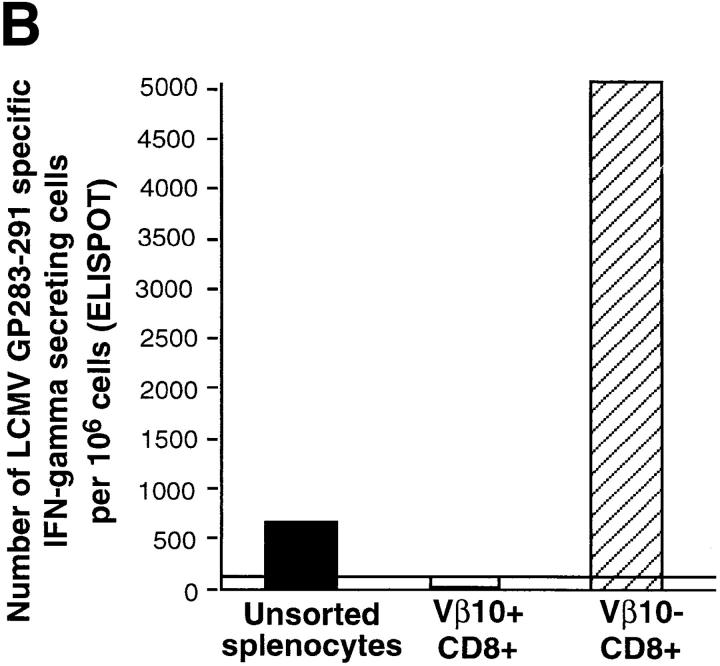
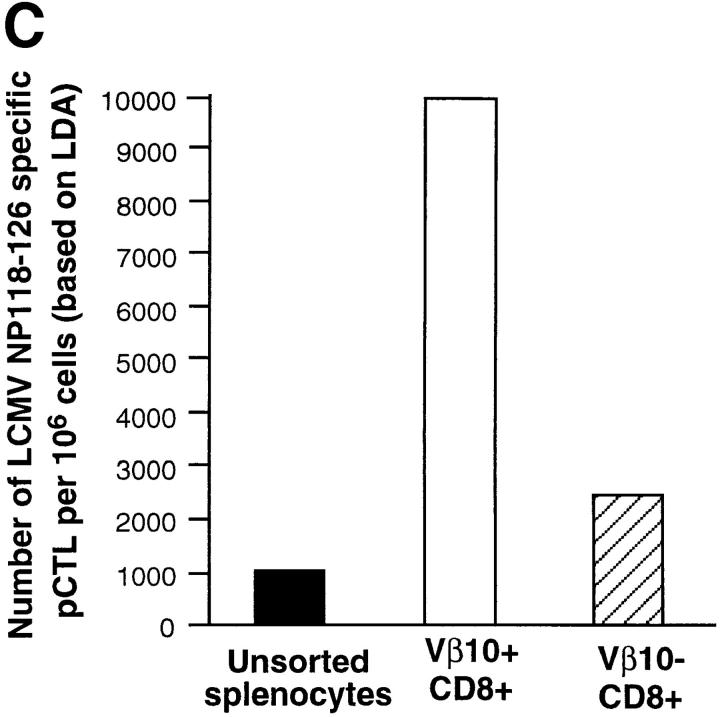
Figure 6.
Functional analyses of sorted Vβ10+CD8+ and Vβ10−CD8+ cells. IFN-γ ELISPOT assays measuring the frequencies of LCMV-specific T cells in the unsorted or sorted populations. (A) Frequencies of NP118–126-specific cells. (B) Frequencies of GP283–292-specific T cells. (C) LDA of NP118–126-specific CTL precursor in the unsorted or sorted populations.


