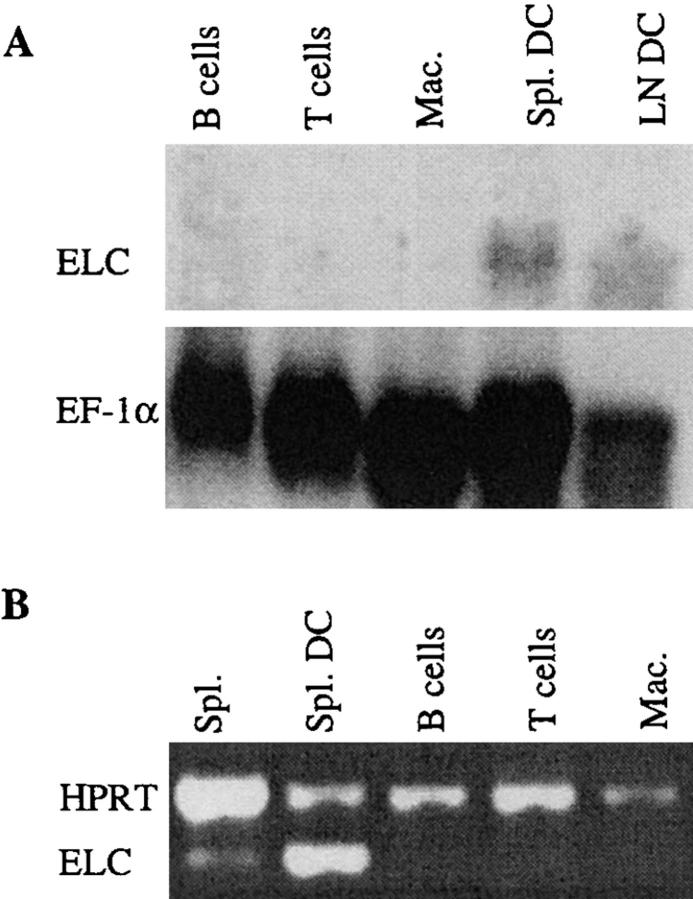
Figure 4.
ELC expression in purified cells. (A) Northern blot analysis of ELC expression in MACS®-purified spleen B cells and T cells, mouse peritoneal macrophages (Mac.), and spleen (Spl.) and LN DCs purified to ∼70%. EF-1α hybridization is shown to control for amounts of RNA loaded. (B) RT-PCR analysis of ELC expression in total spleen before sorting (Spl.) and in splenic CD11c+ DCs isolated by FACS® sorting (Spl. DC), and lack of expression in purified spleen B cells and T cells and peritoneal macrophages (Mac.). Primers specific for HPRT were included in each sample as a reaction control.

