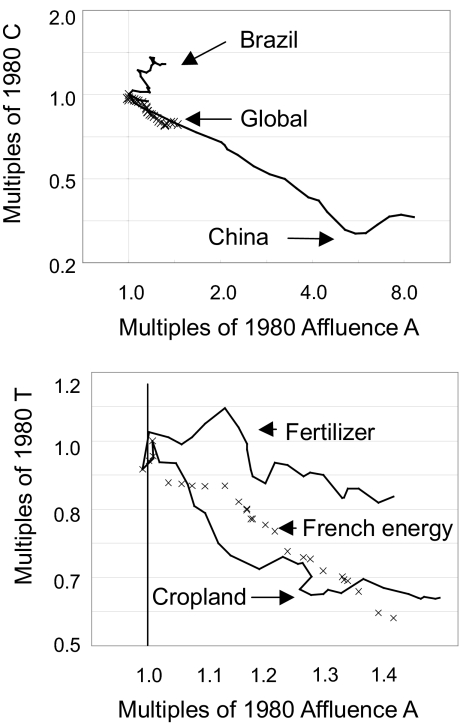
Fig. 1.
A variety of change as affluence A increased. (Upper) From 1980 to 2006, the declining energy intensity globally and in China, and its rise in Brazil, illustrate the variety and wide spread of dematerialization of C. The U.S. Dept of Energy Information Agency (DOE) reports were extended from 2005 to 2006 with British Petroleum (BP) reports. (Lower) From 1980 to 2005, the declining intensities of impact T of fertilizer and cropland per crop production index and of emission per French energy (13–17).

