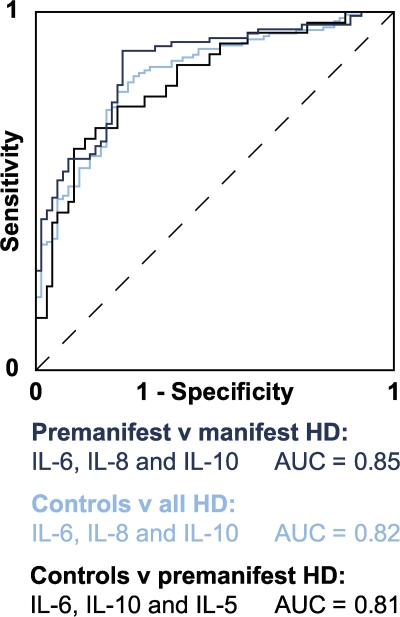
Figure 4.
ROC curves demonstrating the ability of different combinations of plasma cytokine levels to discriminate between subject groups. In a ROC curve plot, the “true positive” diagnosis rate (sensitivity) is plotted against the “false positive” diagnosis rate (1-specificity) for a test with a binary outcome. The AUC summarizes the discrimination of the test, i.e., its ability to classify cases correctly. A perfect test would have an AUC of 1; a worthless test would have an AUC of 0.5. AUC values may be classified as follows: 0.9–1, excellent; 0.8–0.9, good; 0.7–0.8, fair; 0.6–0.7, poor; 0.5–0.6, fail (reference 36). For the present analysis, optimum combinations were identified by stepwise logistic regression analysis using a threshold of P = 0.05 for each cytokine removed from the model. A combination of IL-6, IL-10, and IL-5 best discriminated between controls and premanifest HD; a combination of IL-6, IL-8, and IL-10 best discriminated manifest from premanifest HD; and a combination of IL-6, IL-8, and IL-10 best discriminated controls from HD gene carriers (both premanifest and manifest).

