
Figure 2.
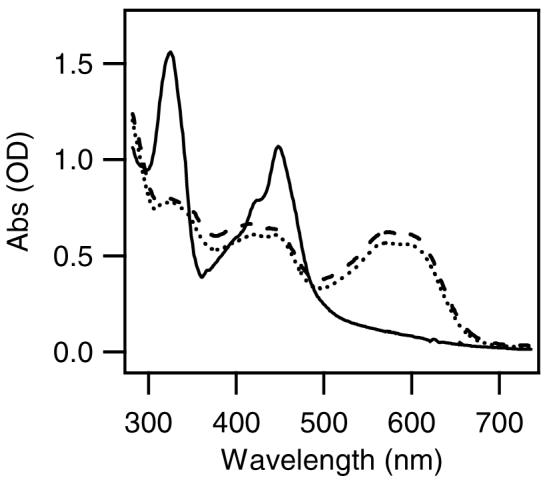
Absorption spectra of P4+ (12.8 μM) before (solid line) and after (dotted line) addition of 10 equiv. GSH in anaerobic 7 mM Na3PO4 buffer (pH 7.0). Dashed line is the absorption spectrum of H2P4+ in MeCN when prepared by stioichiometeric cobaltocene reduction and trifluoroacetic acid protonation.42