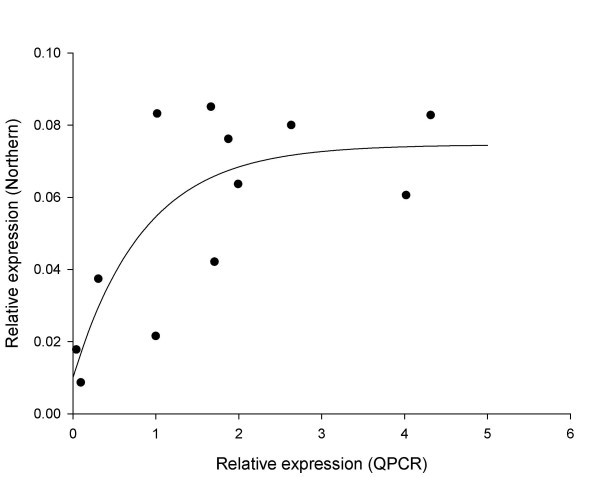
Figure 1.
Example showing the saturation of Northern-derived signal. Exponential regression curve showing the relationship between the Northern analysis response (y axis) and the qRT-PCR response (x axis) for glucuronyl hydrolase during 5 days post-harvest storage. Fitted equation is y = 0.0746 – 0.0646 * 0.309x, R2 = 52.5%.

