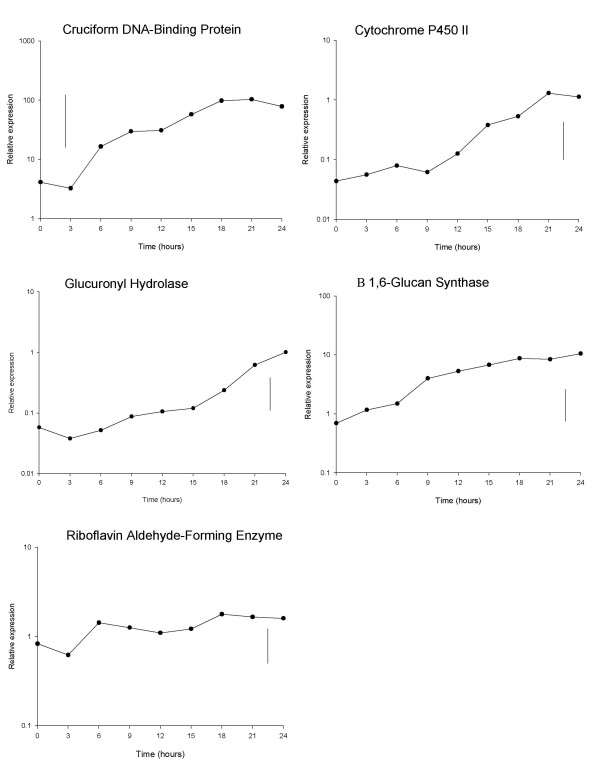
Figure 2.
Gene expression during the first 24 hours post-harvest sampling at 3 hourly intervals. Mean qRT-PCR (log10-transformed) measurements of gene expression of the 5 selected genes during the first 24 hours post-harvest storage, sampling at 3 hourly intervals. Vertical lines show LSD (5%, 16d.f.) for comparing means at different times, as calculated from the residual mean square obtained from the ANOVA.

