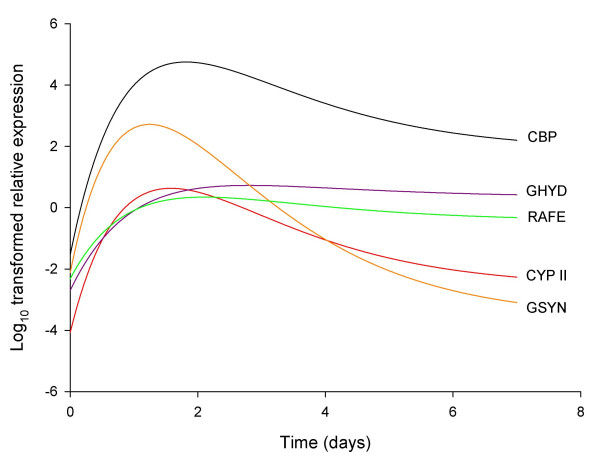
Figure 5.
Critical exponential curve models for transcription patterns during 5 days post-harvest development. Sampling was conducted at 24 hour intervals. Models for log10-transformed qRT-PCR gene expression as given by Equation 1, with fitted parameters as given in Table 1. CBP (black line) = cruciform DNA-binding protein, CYPII (red line) = cytochrome P450II, GHYD (blue line) = glucuronyl hydrolase, GSYN (orange line) = β (1–6) glucan synthase, and RAFE (green line) = riboflavin aldehyde-forming enzyme.

