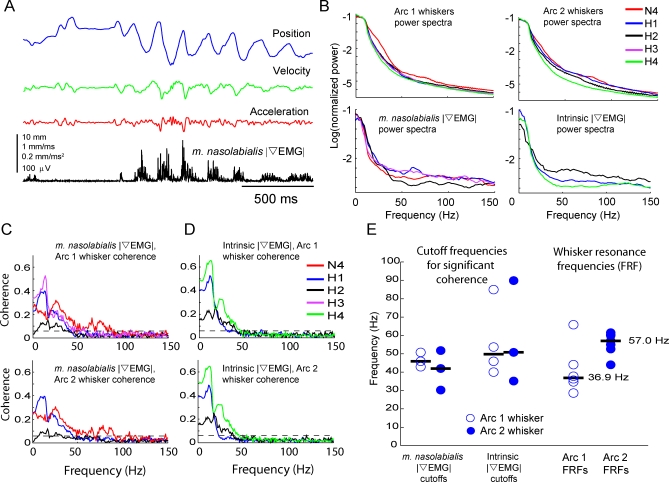
Figure 6. Coherence between Whisker Vibration and |∇EMG| of Whisker Muscles during Whisking in Air.
(A) Example |∇EMG| from an extrinsic muscle and movement of the D1 whisker (rat H3).
(B) Power spectra for whisker motion and |∇EMG| for all whiskers and muscles measured. Legend indicates animal identity. Each power spectrum was normalized to its total power.
(C) Coherence between m. nasolabialis |∇EMG| and arc 1 whiskers (top) and arc 2 whiskers (bottom). Each line is coherence between one |∇EMG| recording and one whisker, recorded in one animal. Dashed black line shows p = 0.05 significance level. Coherence traces are color coded according to animal.
(D) Coherence between intrinsic |∇EMG| and whisker motion. Plotted as in (B).
(E) Cutoff frequencies for significant coherence between |∇EMG| recordings and whisker motion (frequency at which coherence dropped below significance), compared to measured FRFs for the same whiskers.

