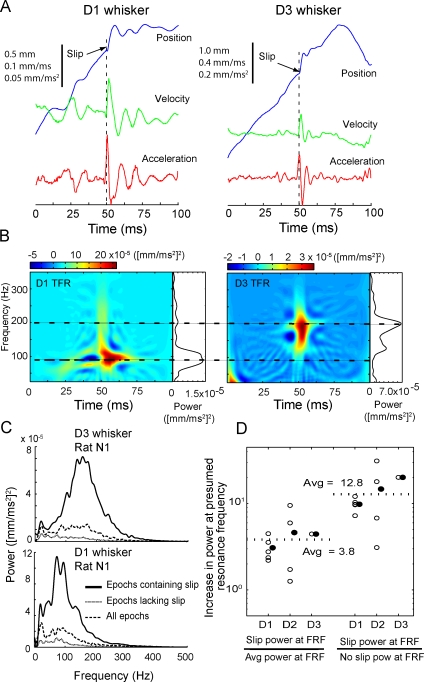
Figure 9. Resonance Vibrations on Surfaces Represent Transient Ringing Following Discrete High-Acceleration Events.
(A) Examples of high-acceleration whisker movement for a D1 and a D3 whisker in rat N1. Movement event onset is marked by an acceleration peak (aligned at 50 ms), followed by transient, decaying ringing in acceleration, velocity, and position.
(B) TFR of the movement traces shown in (A), showing power at 90 Hz (D1 whisker) and 180 Hz (D3 whisker) following the high-acceleration event.
(C) Comparison of average power spectra in 400-ms epochs containing a high-acceleration event (black), lacking such an event (dotted), or for all whisking epochs (dashed). Power spectra were derived from motion of the D1 and D3 whiskers in rat N1, averaged across all textures.
(D) Analysis of increase in power at high-frequency (presumed resonance) peak during high-acceleration event, for all whiskers studied. Plot shows ratio of power at high-frequency peak in epochs containing high-acceleration events to power at this frequency for all whisking epochs (left), and to power at this frequency for epochs lacking high-acceleration events (right). Each open circle represents a single whisker averaged over all textures. Filled circles show average across all individual measured whiskers.

