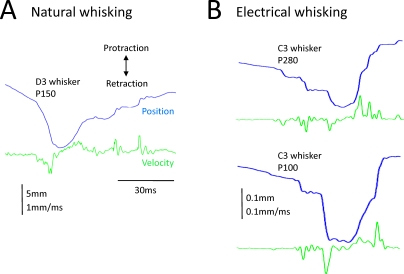
Figure 3. Comparison of Whisker Motion Profiles Collected under Different Conditions.
Kinetic signatures are apparent in position (blue traces) and velocity (green traces), and these are conserved across experimental conditions.
(A) Contact of D3 whisker with texture P150, measured ~10 mm from the base (adapted from [12]). (B) Contact of C3 whisker with texture P280 (upper panel) and with texture P100 (lower panel), both measured 1 mm from the base (adapted from [10]).

