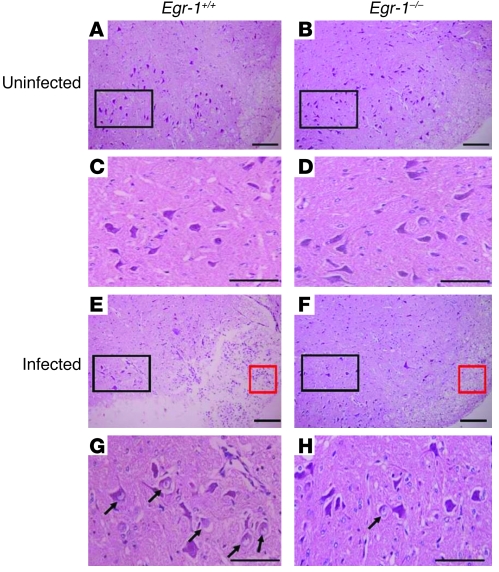
Figure 5. Inflammatory cell infiltration and neuron damage in infected mouse brain stems.
Sections of brain stems from uninfected (A–D) and infected Egr-1+/+ and Egr-1–/– mice (E–H) stained with H&E are shown. The black boxes in A, B, E, and F are enlarged and shown in C, D, G, and H, respectively. More inflammatory cellular infiltration (red boxes in E and F) and damaged neurons with swollen nuclei (arrows in G and H) are noted in the brains of infected Egr-1+/+ mice at day 9 p.i. Scale bars: 100 μm. Data are representative of 2 experiments.

