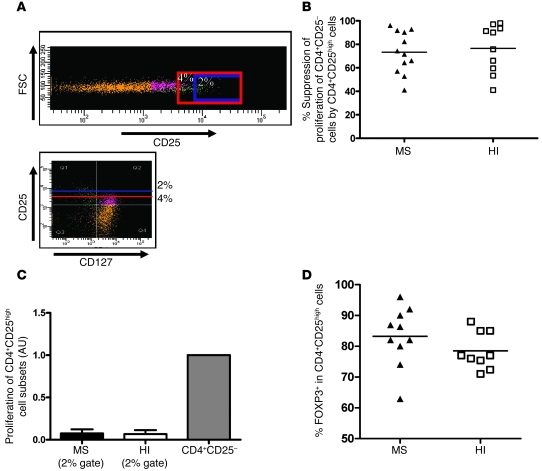
Figure 2. Suppressive activity and proliferation of the top 2% of sorted CD4+CD25high cells from MS patients and healthy controls.
(A) CD4+ lymphocytes obtained from the peripheral blood of MS patients and healthy controls were stained with Pe-Cy7–conjugated anti-CD3, FITC-conjugated anti-CD8, Alexa Fluor 647–conjugated anti-CD25, and PE-conjugated anti-CD127. Sorting was performed on the CD4+CD25highCD127low and CD4+CD25highCD127high populations. Sorting was also performed on the CD4+CD25high population with 2 different gates. In the example provided for 1 MS patient, CD4+CD25+ T cells appear in orange, CD4+CD25+CD127low T cells appear in green, and CD127high cells appear in violet. The presence of CD127high activated cells can be observed in the CD4+CD25high sorted T cells when the gate is not stringent enough (4% gating stringency, area above the red line), while in the case of a 2% gating stringency (area above the blue line), only a few CD127high cells remain within the CD4+CD25high T cell subset. FSC, forward scatter. (B) CD4+CD25– responder cells were stimulated with anti-CD3 antibody (0.1 μg/ml) in coculture with the top 2% of CD4+CD25high sorted cells. Data are the mean of duplicate wells. Regulatory properties of CD4+CD25high cells are comparable in both HIs (n = 10) and patients (n = 12). (C) Comparison of the proliferation of the top 2% of sorted CD4+CD25high T cells in MS patients and HIs relative to the proliferation of the CD4+CD25– T cell subset. The proliferation of CD4+CD25high T cells was minimal and almost null in both patients and controls. Data are mean ± SD. (D) Intracellular FOXP3 staining was performed on the top 2% of sorted CD4+CD25high T cells in 10 patients and 9 HIs. In B and D, the mean values for each group are indicated by horizontal lines.

