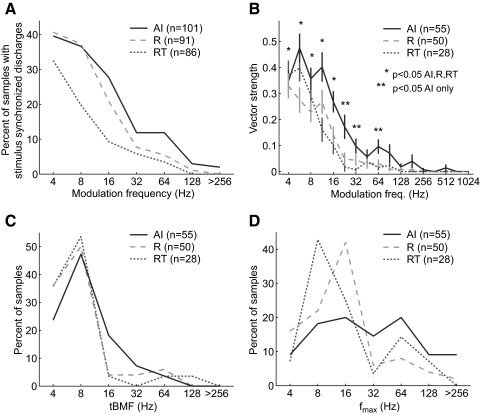
FIG. 14.
Temporal response properties of neurons in AI, R, and RT. A: percentage of samples with stimulus locked discharges in AI, R, and RT. B: average vector strength of AI, R, and RT populations. Average vector strengths significantly different from zero (Wilcoxon rank-sum test, Bonferroni corrected, P < 0.05) are indicated. C: distribution of temporal best modulation frequencies (tBMFs) in AI, R, and RT. D: distribution of the stimulus synchronization limit (fmax) in AI, R, and RT.

