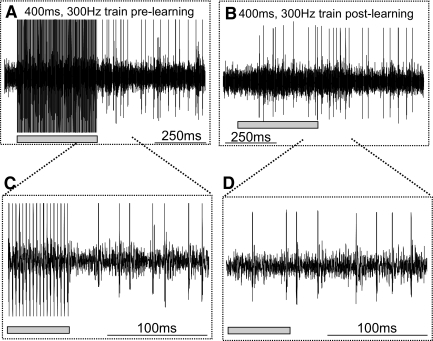
FIG. 2.
Examples of spike trains before and after stimulus artifact learning. A: 1,000-ms sweep of the voltage trace (in analog-to-digital [A/D] units) plotted against time. A 300-Hz, 50-μA train of pulses recorded as artifact from the electrode in the SC. B: 1,000-ms sweep of the voltage trace from the same recording day but a different trial after the Artifact Zapper learned the stimulus artifact. C: the same recording as shown in A in expanded view. Only 18 pulses (60 ms) of the 300-Hz, 400-ms stimulus train are seen. D: the same trace as in B expanded in time. The oblique dotted lines indicate the regions of the top traces that were expanded in time. The filled gray rectangles show the regions of the traces where the artifact occurred. There is a small amount of temporal jitter between the onset of the stimulation train shown in B and C compared with the onset shown in A and D because the exact time of the onset of the stimulation varied across trials.

