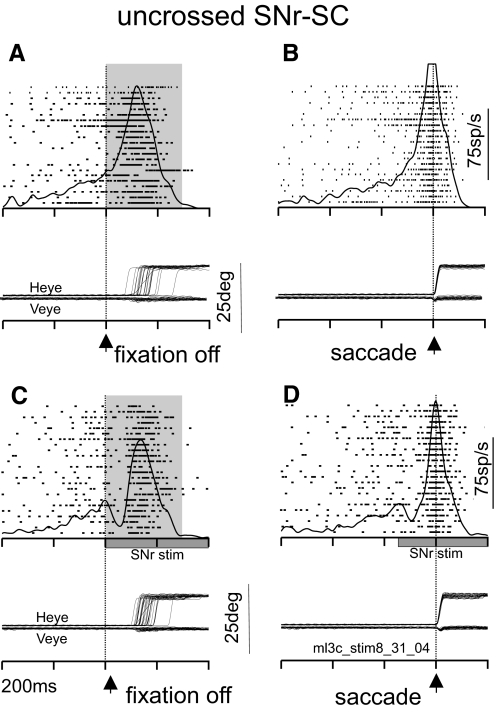
FIG. 3.
SNr stimulation suppresses ipsilateral SC neuronal activity. In each panel, each tick indicates the time of occurrence of an action potential and each row indicates a trial in which the monkey made a rightward saccade (raster). The spike density functions (σ = 12 ms used for display) are superimposed on the rasters. A: example SC neuron without SNr stimulation aligned on the offset of the fixation point. The alignment is indicated by the dashed vertical line and the arrowhead at the bottom of the panel. The shading indicates the interval over which discharge rate was measured. B: same neuron as shown in A, but aligned on the onset of the saccade. The alignment is indicated by the dashed vertical line and the arrowhead. C: the same neuron as shown in A and B, but now for trials in which SNr stimulation was applied. The traces are aligned on fixation spot offset. The shading indicates the interval over which discharge rate was measured. The stimulation train is indicated by the gray rectangle on the abscissa. D: the same neuron as in A and B now aligned to the onset of the saccade and with SNr stimulation. The stimulation train is indicated by the gray rectangle on the abscissa. Heye, horizontal eye position; Veye, vertical eye position; fpoff, fixation point offset. Each tick on the time axis is separated by 200 ms (ml3c_stim8_31_04 is the filename used for reference).

