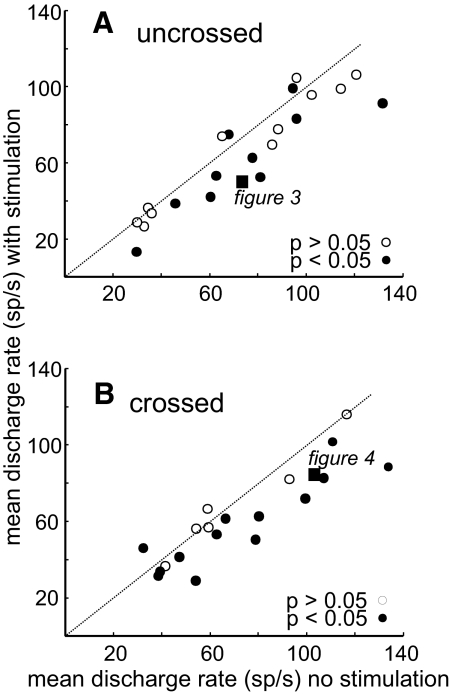
FIG. 5.
SNr stimulation primarily suppresses SC neuronal activity. A: mean discharge rate (spikes/s) with SNr stimulation plotted against mean discharge rate (spikes/s) without SNr stimulation for all SC neurons recorded in the same hemisphere as the SNr stimulated (uncrossed). The dotted oblique line is the line of unity. Points falling below the line indicate decreased discharge rate (during the 300-ms interval after fixation point offset/stimulation onset) with stimulation. Points above the line indicate increased discharge rate with SNr stimulation. Filled black circles indicate neurons with statistically significant differences between the stimulation and no-stimulation condition (Wilcoxon, P < 0.05). Unfilled circles indicate no significant difference between discharge rates of SC neurons with SNr stimulation (Wilcoxon, P > 0.05). The filled square is from the example neuron shown in Fig. 3. B: same as in A for the SC neurons recorded in the hemisphere opposite the side of SNr stimulation (crossed). The filled square shows the result for the example neuron shown in Fig. 4.

