FIG. 6.
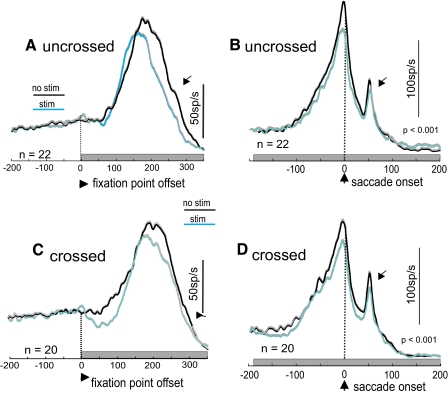
SNr stimulation suppresses saccade-related discharge of SC neurons. A: the average spike density function (σ = 12 ms for display) from 22 SC neurons recorded on the same side as SNr stimulation (uncrossed). Black lines: without stimulation of the SNr; blue lines: with stimulation of the SNr. The thin gray lines (barely visible) are 1SE. The traces are aligned on the fixation point offset indicated by the dashed vertical line and arrowhead at time 0 ms. The gray rectangle indicates the onset and duration of the SNr stimulation train. B: same neuron as shown in A but now the traces are aligned on the onset of the saccade indicated by the vertical dashed line and the arrowhead at time 0 ms. C: the average spike density function from 20 SC neurons recorded on the opposite side relative to the SNr stimulation (crossed). Traces are aligned on the fixation point offset (stimulation onset) indicated by the dashed vertical line, arrowhead at time 0 ms. The gray rectangle shows the stimulation train. D: the same neurons as shown in C but now the traces are aligned on the onset of the saccade. Each tick on the abscissa in each panel is separated 50 ms. Arrows point to the visual transient occurring after the saccade.

