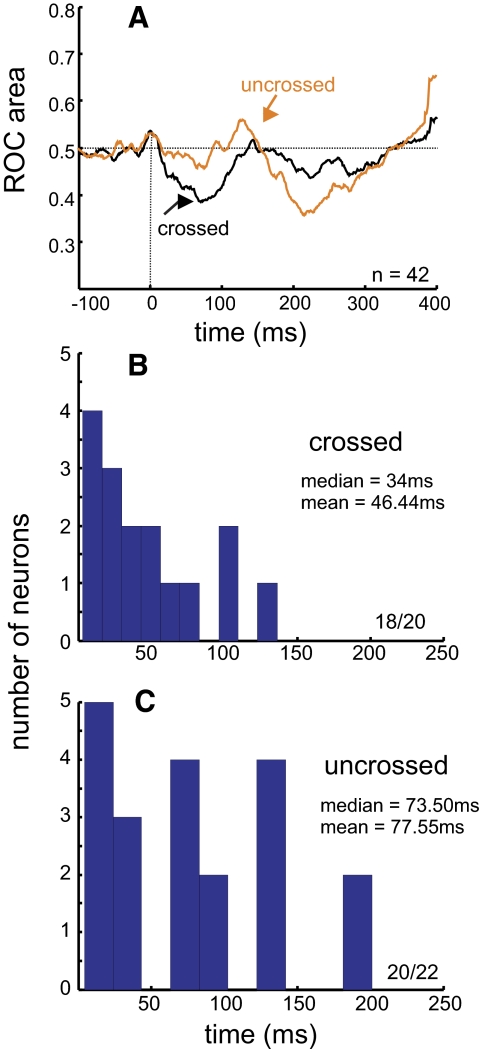
FIG. 7.
Time course of SNr stimulation effects on SC neuronal activity. A: receiver operating characteristic (ROC) area is plotted against time for all 42 SC neurons. The black line shows the result from the 20 crossed neurons; the red line shows the result from the 22 uncrossed neurons. The horizontal dashed line indicates a 0.50 ROC area. (See text for description of how ROC area was calculated.) Values <0.50 indicate suppressed neuronal activity with SNr stimulation, whereas values >0.50 indicate enhanced neuronal activity with SNr stimulation. B: frequency distribution of statistically significant separation times of neuronal activity recorded from crossed SC neurons; 18/20 crossed SC neurons had significant separation times. C: the same as in B except for SC neurons recorded on the same side as the SNr stimulation; 20/22 uncrossed SC neurons had significant separation times.

