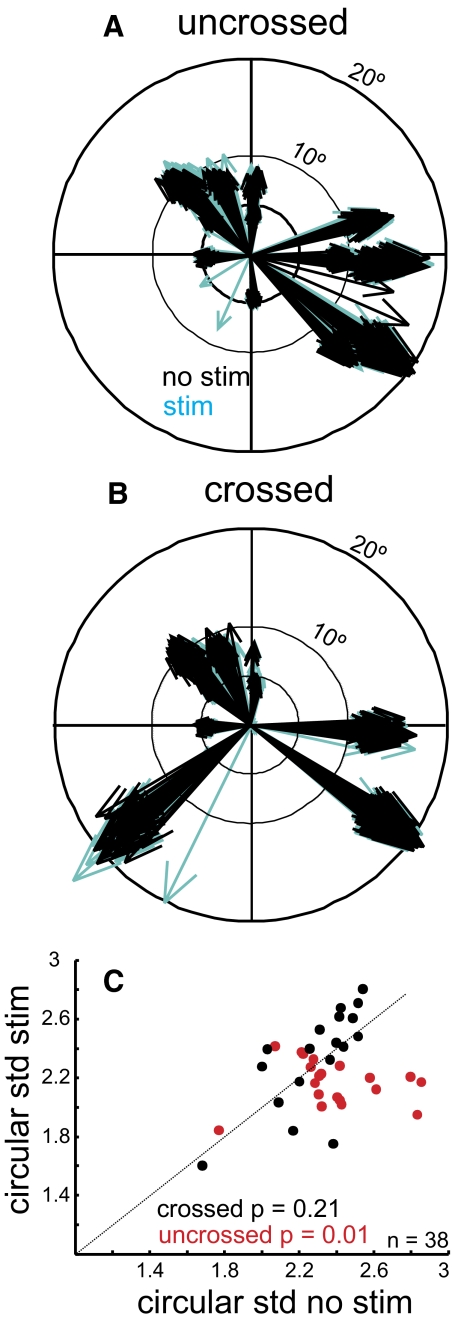
FIG. 9.
SNr stimulation alters visually guided saccade direction. A: saccade vectors are indicated by the arrows. Black arrows are no-stimulation trials and blue arrows are stimulation trials. Each saccade recorded from each trial and each experiment is plotted in polar coordinates for the uncrossed data. B: the same as in A for the crossed data. The direction of each arrow indicates the saccade direction and thus the preferred direction of the SC neuron for that recording day. Note that multiple experiments may have had multiple similar directions. C: the circular SD of saccade directions measured across trials with SNr stimulation is plotted against the circular SD of saccade directions measured across trials without SNr stimulation. The red circles show the data obtained from trials in which the SC neurons recorded were on the same side as the SNr stimulation (20 uncrossed neurons). The black circles show the data obtained from trials in which the SC neurons recorded were on the opposite side as the SNr stimulation (18 crossed neurons). The oblique dashed line is the line of unity. Points falling below the line indicate a reduced SD in the stimulated trials. Only the neurons with statistically significant suppression of neuronal activity during SNr stimulation as determined by ROC and the permutation test (see text) are shown.

