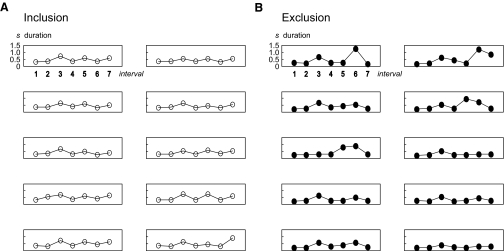
FIG. 3.
Example of a typical performance in the two generation tasks. Each diagram represents the generated rhythm in one trial, with interval number on the x-axis and duration on the y-axis. The scale is the same in all diagrams. A: the 10 trials generated in the inclusion task. B: the 10 trials generated in the exclusion task.

