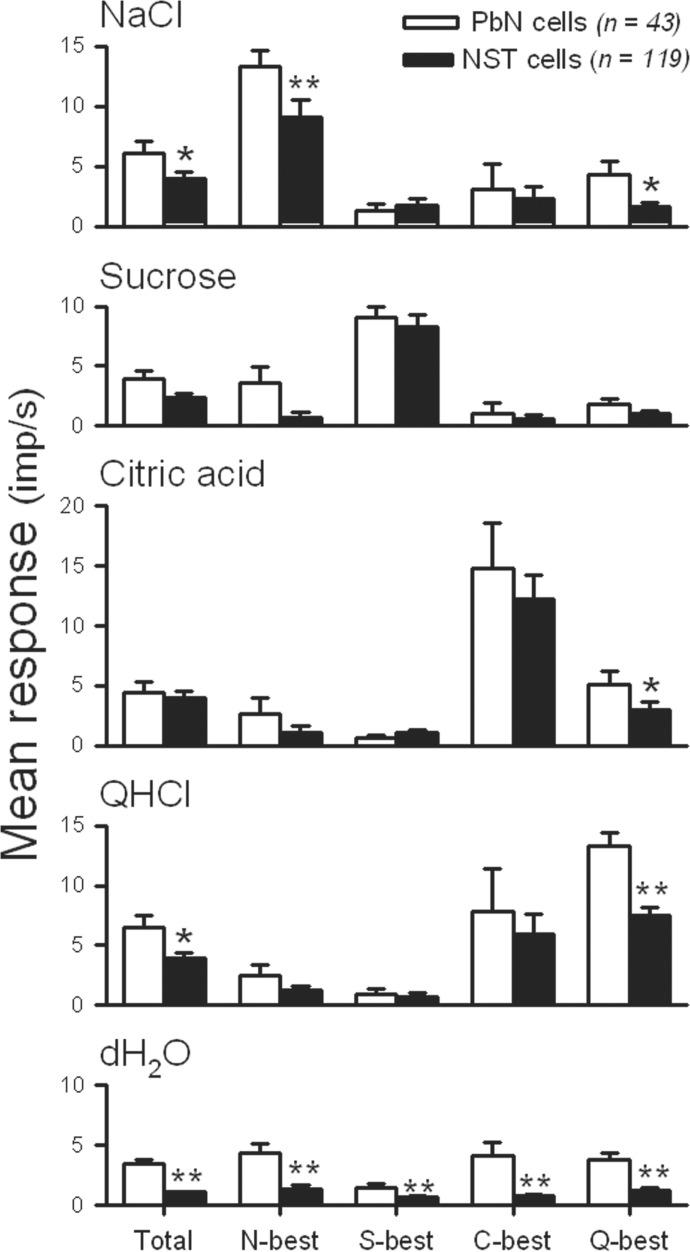
FIG. 3.
Comparison of the mean firing rate (±SE, impulses/s) of taste neurons as a function of best-stimulus category (columns) in response to the 4 taste stimuli, and distilled water (rows) in the PbN (open bars) and NST (filled bars). Total, N-best, S-best, C-best, Q-best, and dH2O correspond to the total sample, NaCl-best, sucrose-best, citric acid-best, QHCl-best, and distilled water, respectively. *P < 0.05; **P < 0.01.

