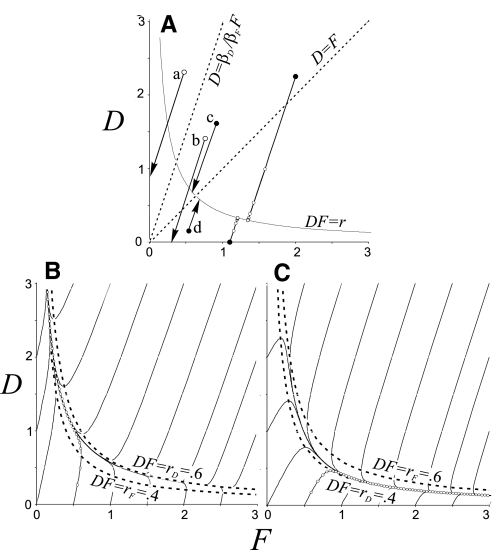
FIG. A1.
Plots of D as a function of F. Explanation and interpretation in appendix. βD = 0.12; βF = 0.04 throughout. Various reference lines, defined on the graphs, are dashed. A: rD = rF = r. Trajectories starting at filled points show behavior of model 2 in the presence of serotonin when r = 0.4. Trajectories starting at open circles show washout behavior (r = 0). Tiny open circles along trajectories are 1-min time marks. B and C: behavior in the presence of serotonin when rD = 0.6 and rF = 0.4 (B) or conversely (C) (discussed in text).

