FIG. 5.
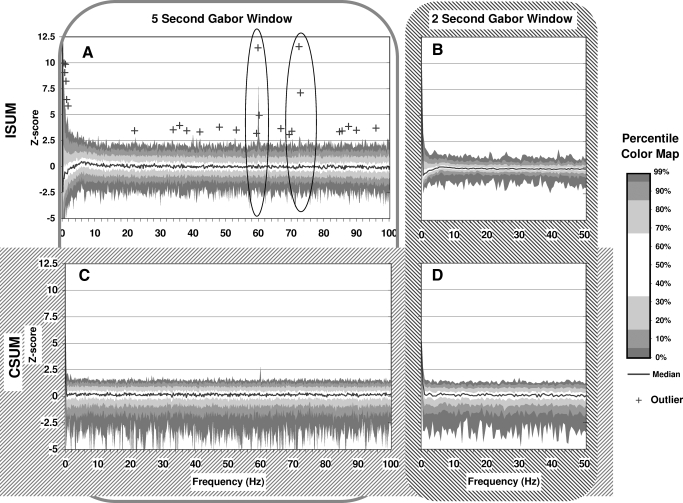
Gabor Transform Distribution of Frequencies. Gabor transform summaries for all recordings were calculated and are plotted in four different ways (A, B, C, and D). For each recording, Gabor transforms were calculated using both 2.0 s (A and C) and 5.0 s time windows (B and D). For each window size, the results were summarized by summing the values of Gabor transforms across time, once by summing the amplitudes (ISUM, A and B) and once summing the complex value Gabor transform results (CSUM, C and D) before converting results to amplitudes. For comparison, the Gabor transform resulting ISUM and CSUM power spectrum plots were normalized to their own baseline log-power on a Zscale similar to auto-correlogram FFT plots. The Z-score percentile plots (A individual outliers) are plotted here comparing individual frequency terms across all recordings.

