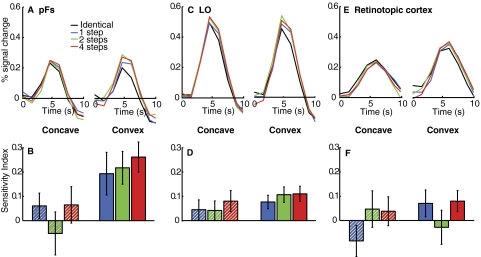
FIG. 2.
Functional magnetic resonance imaging (fMRI) results, experiment 1. Hemodynamic response curves in anterior lateral occipital complex (LOC) (posterior fusiform gyrus [pFs], A), posterior LOC (LO, C), and retinotopic cortex (E) are shown separately for concave (left panels) and convex stimuli (right panels). A higher response for different than that for identical conditions indicates sensitivity to the stimulus difference. Sensitivity index for pFs (B), LO (D), and retinotopic cortex (F). A high index indicates high sensitivity to changes in the stimulus. Greater sensitivity for convex than concave shapes was found in pFs, but not in either LO or retinotopic cortex.

