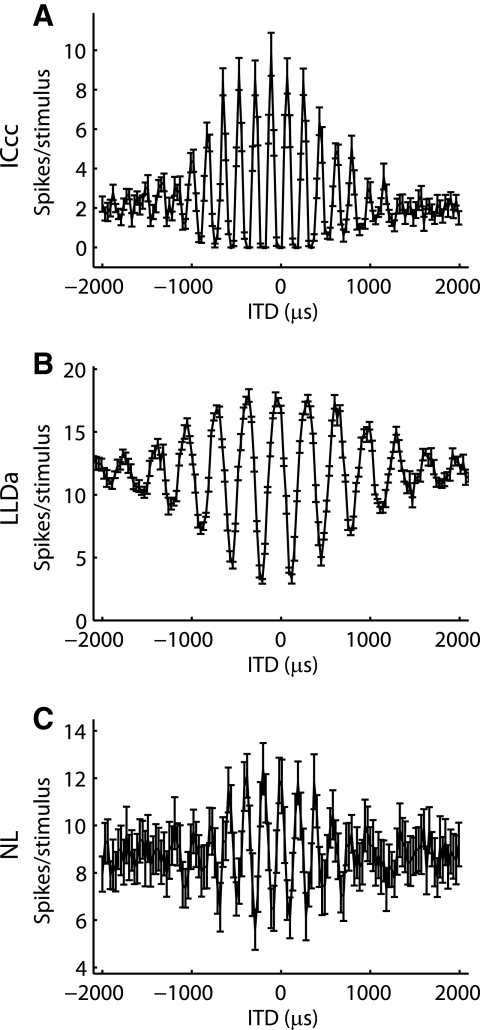
FIG. 4.
Rectification of ITD tuning curves. Example long-range ITD curves for ICcc (A), LLDa (B), and NL (C) neurons. The error bars represent the SE over 10 trials. The ITD tuning curves of NL and LLDa neurons are approximately symmetrical about the mean, but the ITD tuning curve of the ICcc neuron shows rectification.

