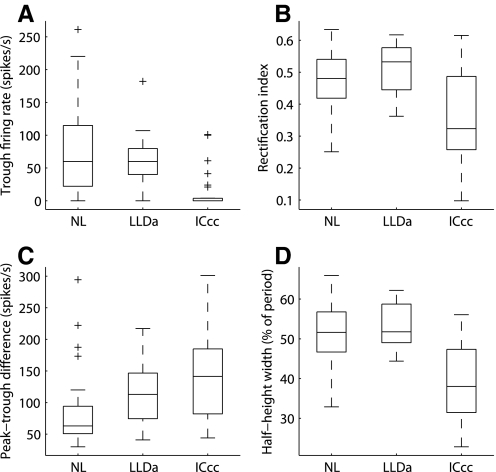
FIG. 5.
ITD tuning curve shape. ITD tuning curve shapes of NL, LLDa, and ICcc neurons quantified by the trough firing rate (A), the rectification index (B), the peak-trough difference (C), and the half-height width (D) expressed as percent of period. Box plots are as in Fig. 3.

