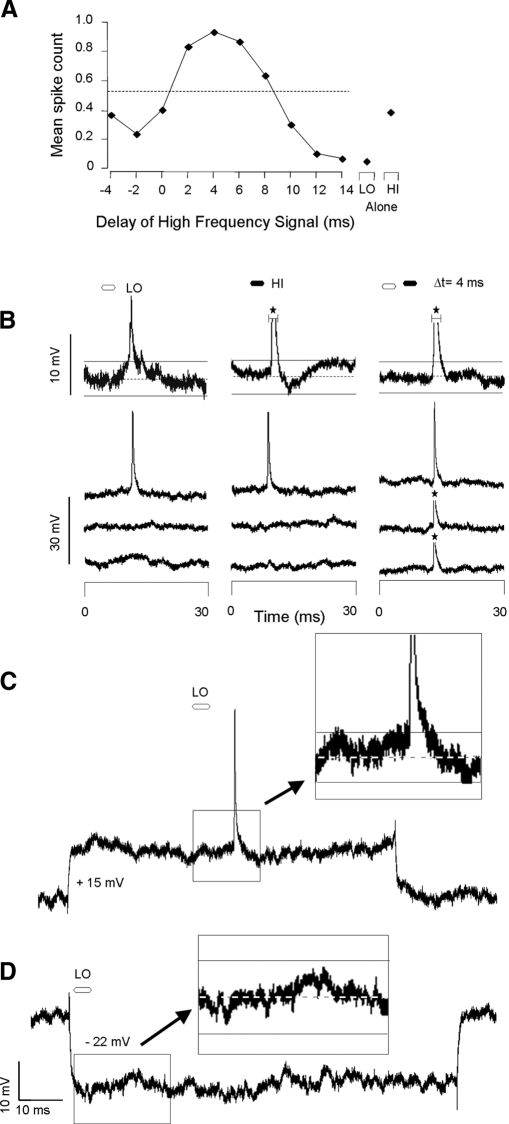
FIG. 11.
Lack of observable transient hyperpolarizations is not explained by shunting inhibition. A: delay curve shows facilitation when the high-frequency sweep preceded the low-frequency sweep by 2–8 ms. Dashed line indicates criterion for facilitation; values above the line exceed our criterion for facilitation. B: averaged (top trace; n = 9) and individual voltage traces show no IPSPs. Resting membrane potential = −58 mV; spike height = 35 mV. C: intracellular trace with a depolarizing current injection. For this trace, resting membrane potential = −59 mV. D: intracellular trace with hyperpolarizing current injection. For this trace, resting membrane potential = −57 mV. Current injection did not show potentially inhibitory conductances. B–D: dashed horizontal line indicates the resting membrane potential and the horizontal solid lines indicate the 95% CLs of the resting membrane potential. See Fig. 2 for protocol.

