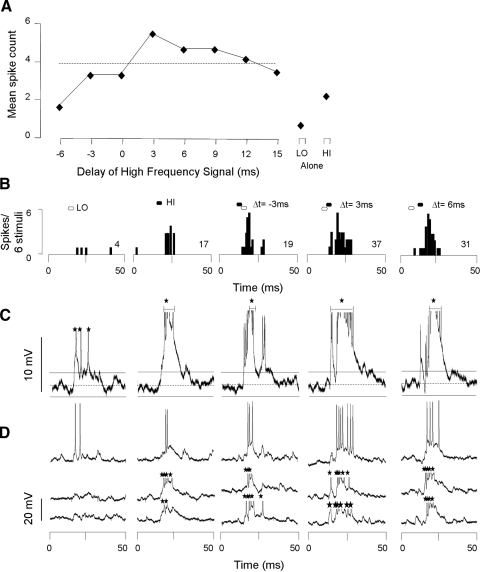
FIG. 2.
Facilitatory combination-sensitive neuron does not show hyperpolarization in response to low- or high-frequency stimuli. A: spike-based response of neuron as function of delay between low- and high-frequency stimuli. Response to separate low (LO) and high (HI) frequency sweeps shown at right. Dashed line, criterion for facilitation; values above the line exceed our criterion for facilitation. B: poststimulus time histograms (PSTHs) display spike response to particular stimulus combinations. Filled and unfilled hexagons above PSTHs represent the timing of HI and LO signals, respectively, and apply to B–D. Numbers at right in PSTHs indicate total spike count for the indicated number of stimulus repetitions. C: averaged voltage traces (n = 6) for all intracellular responses to the stimulus indicated above B. On the averaged trace, the dashed horizontal line indicates the resting membrane potential (−72 mV) and the horizontal solid lines indicate the 95% CLs of the resting membrane potential. Only values exceeding the 95% CLs are judged to be significant responses to sound. Neither the LO nor HI signals generated IPSPs. Note that spike height is altered by the averaging process. D: 3 of 6 individual voltage traces that contribute to the average in C. Only averaged voltage tracers were used to assess the presence or absence of transient membrane potential changes. Black stars indicate truncated spikes. Spike height = 45 mV.

