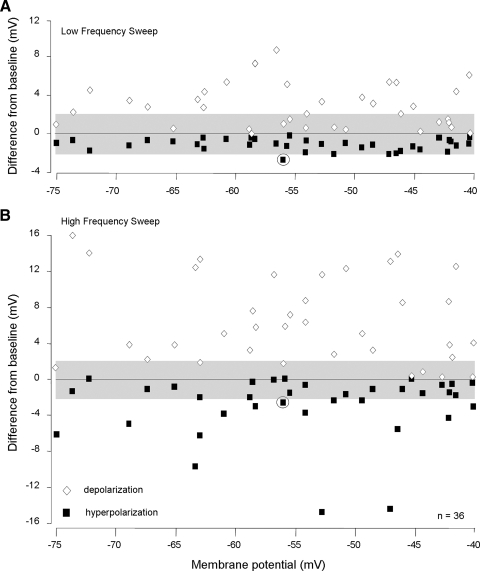
FIG. 5.
Neurons with facilitatory combination-sensitive responses had a wide range of resting membrane potentials. A: for each facilitated neuron, the graph shows maximal averaged poststimulus depolarization and hyperpolarization in response to low-frequency sweeps. The grayed area indicates ±2 mV that approximates the 95% CLs for each neuron. Only values exceeding the 95% CLs were considered to be significant depolarizing or hyperpolarizing responses. The circled symbols designate the only neuron with a significant low frequency–evoked hyperpolarization (see Fig. 4). B: graph shows maximal averaged poststimulus depolarization and hyperpolarization in response to high-frequency sweeps. Data in A and B show that the size of hyperpolarization was not related to resting membrane potential. The greater magnitude of high frequency–evoked potentials likely occurs because these neurons were recorded in high-frequency representations of the IC. In this figure, only symbols located completely outside the grayed area represent values that exceed the 95% CL.

