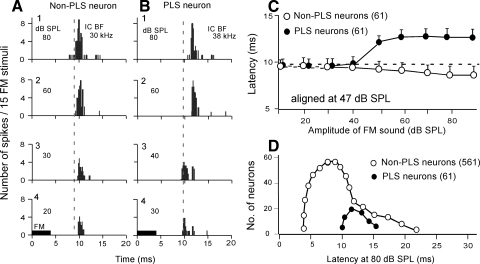
FIG. 1.
Changes in the response latencies of single collicular neurons with stimulus amplitudes. Each poststimulus-time (PST) histogram displays the response of a single neuron to a FM sound repeated 15 times. A: a non-paradoxical latency-shift (PLS) neuron showed longer response latencies to smaller stimulus amplitudes. B: a PLS neuron showed shorter response latencies to stimulus amplitudes <50 dB SPL. C: the mean amplitude-latency functions of 61 non-PLS (○) and 61 PLS neurons (•). Each data point shows a mean ± SE. D: the distributions of response latencies of PLS and non-PLS neurons at 80 dB SPL and the best frequency (BF) of a given neuron.

