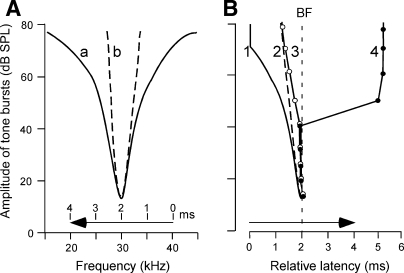
FIG. 8.
Excitatory areas, i.e., frequency-tuning curves (A) and amplitude-latency functions (B) of collicular neurons. A: the excitatory areas in the control (a) and corticofugally sharpened (b) conditions. B: amplitude-latency functions 1 and 2 are respectively based on the time when the 4.0-ms-long FM sound (→) sweeps into the excitatory area a or b in A. Amplitude-latency functions 3 and 4 are those of non-PLS and PLS neurons shown in Fig. 1C, respectively. All the curves are plotted in register at the latencies of curves 1 and 2 at 15 dB SPL.

