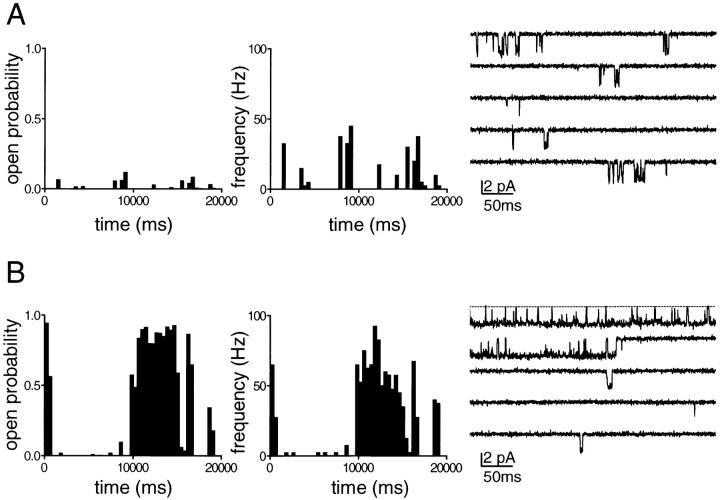
Figure 2.
Approach for classification of the KACh channel gating. Continuous single-channel recordings were divided into consecutive, 400-ms segments and the channel open probability and the frequency of openings were determined for each individual segment. Plots of open probability and frequency of gating vs. time, derived from the continuous KACh channel records illustrated in Fig. 1, are shown for comparison in A and B. Expanded current traces from each of the two records (illustrating the first five 400-ms segments in which KACh channel activity was present) are shown on the right to reveal the kinetic behavior of the channel in greater detail.

