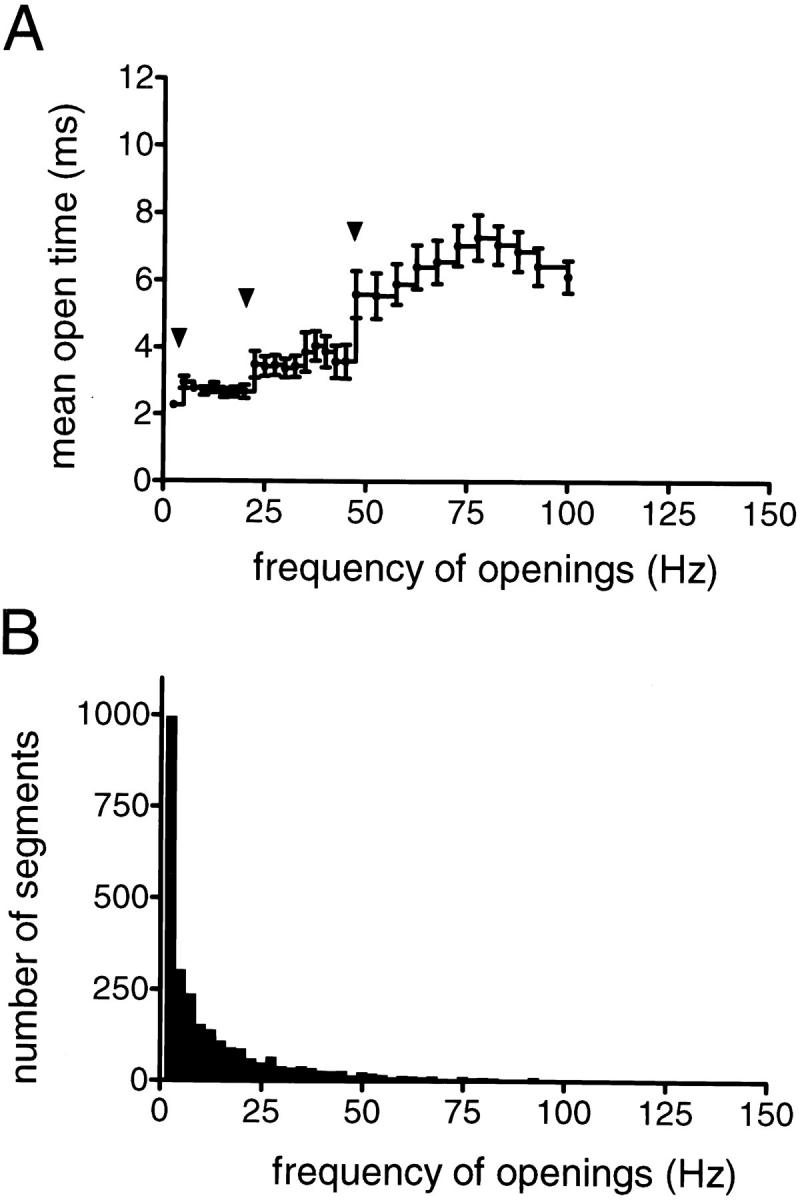
Figure 3.

Segregation of KACh channel behavior into distinct gating modes. (A) The mean open time of the channel, t open, is plotted as a function of the frequency of channel openings, f. The t open value within each 400-ms data segment was calculated from the f and P o values within the same segment. The t open estimates were compiled from a total of 30 min of single-channel data recorded from 10 different cell-attached patches in the presence of 1 μM ACh, and the mean t open value for a particular f population was determined. For the frequencies above 47.5 Hz, where the number of data segments was relatively small, the mean t open value for each frequency, f, was averaged over a 5-Hz interval (f ± 2.5 Hz). The arrowheads in the t open–f plot indicate the statistically significant augmentations in the mean t open value and presumably reflect the transitions from one pattern of KACh channel gating to another. (B) Histogram of frequencies of openings generated from the same set of data shown in A.
