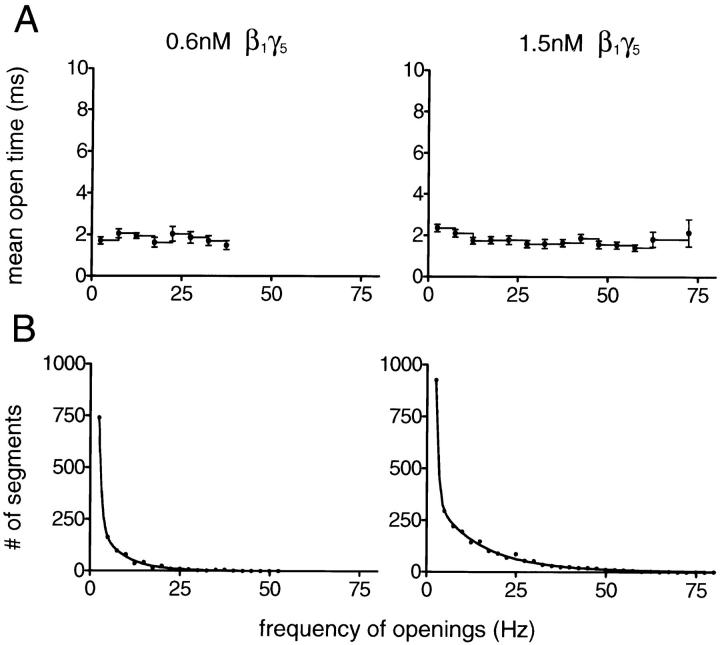
Figure 6.
Modal classification of KACh channel gating in the presence of Gβ1γ5. (A) The t open–f plots were generated from the analysis of the data illustrated in Fig. 5, C and D. In the presence of Gβ1γ5, the mean open time of the KACh channel was independent of the frequency of channel gating and approached the t open value estimated for gating mode 1 of receptor-activated channels. (B) Histograms of frequencies of openings are shown for the experiments illustrated in A. The histogram shown at left corresponds to Gβ1γ5 concentration of 0.6 nM, whereas the histogram shown at right corresponds to Gβ1γ5 concentration of 1.5 nM. Both histograms were fitted by the sum of three geometrics (Colquhoun and Hawkes, 1981): P(f) = a 1μ1 −1(1 − μ1 −1)f − 1 + a 2μ2 −1(1 − μ2 −1)f − 1 + a 3μ3 −1(1 − μ3 −1)f − 1 (continuous line). The mean frequency values and the relative areas of different components are μ1 = 1.4 Hz (73.2%), μ2 = 6.9 Hz (23.5%), and μ3 = 17.6 Hz (3.3%) at 0.6 nM Gβ1γ5; and μ1 = 1.3 Hz (54.9%), μ2 = 12.6 Hz (35.5%), and μ3 = 37.0 Hz (9.6%) at 1.5 nM Gβ1γ5. The proportion of high frequency data segments consistently increased with Gβ1γ5 concentration.

