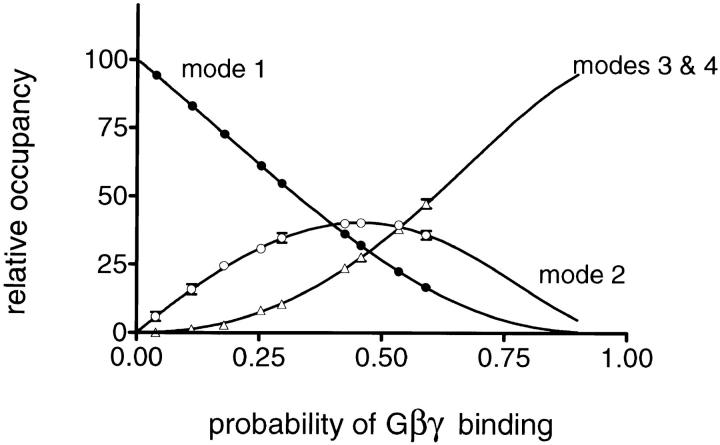
Figure 7.
Modal equilibrium of Gβ1γ5-activated KACh channels. For each individual Gβ1γ5 experiment, the relative occupancy of different gating modes was estimated from the fraction of the f histogram fit by the corresponding geometric component. In some f histograms, the components representing gating modes 3 and 4 were too small to be accurately distinguished from each other and, therefore, the sojourns of the channel to these modes are jointly represented. In each experiment, the probability of Gβ1γ5-binding, P, was calculated from the relative occupancy of mode 1, 𝔉1, according to the equation 𝔉1 = 4P(1 − P)3/[1 − (1 − P)4], as a standardization procedure. The solid lines represent the predicted occupancy of the different gating modes for a model assuming independent and equivalent binding of a different number of Gβγ subunits to four binding sites in the channel structure. The symbols and error bars are the mean values ± SEM of two to four separate experiments.

