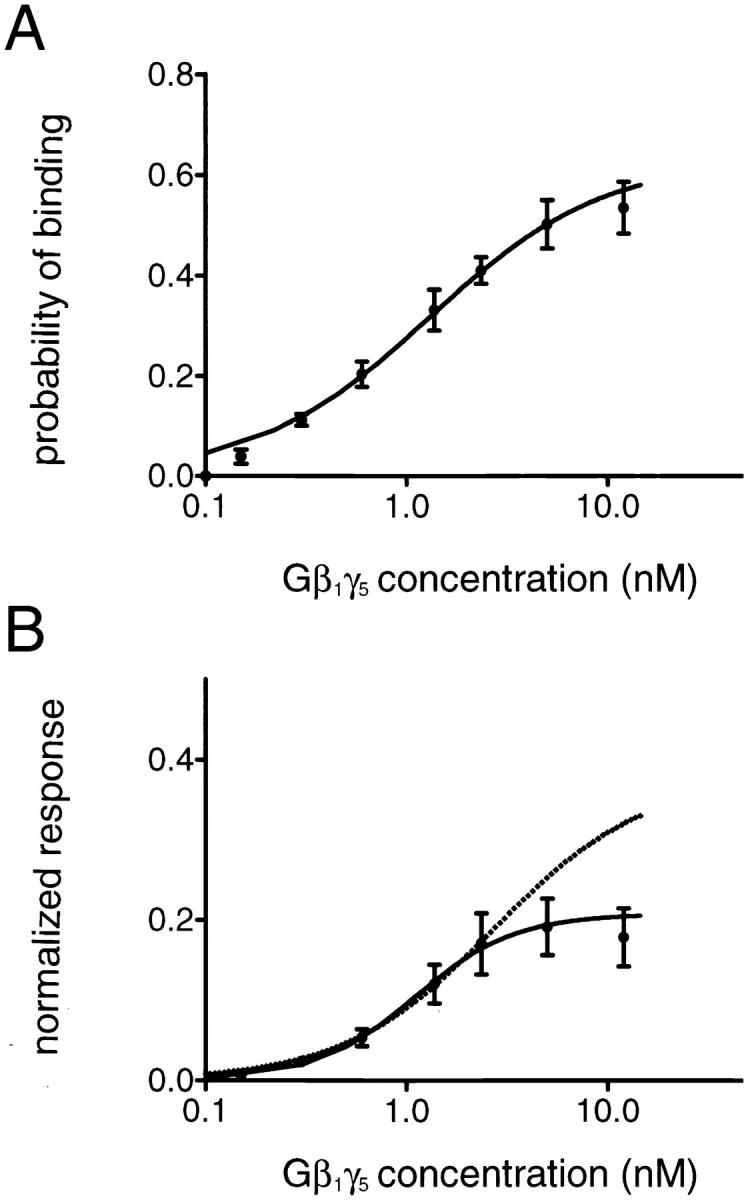
Figure 8.

(A) Gβ1γ5 binding to the KACh channel. The probability of Gβ1γ5 binding, P, is plotted against Gβ1γ5 concentration. The points and error bars represent the mean ± SEM of three to five separate experiments. The solid line through the data represents the least-squares fit with a hyperbolic equation: P = P max[Gβγ]/ ([Gβγ]+ K d), with P max = 0.63 and K d = 1.29 nM. (B) Gβ1γ5-concentration dependence of the KACh channel activation. The steady state KACh channel open probability, P o, is normalized to the open probability of mode 4, P o4Gβγ, determined in each experiment, and the P o/P o4Gβγ ratio is plotted against Gβ1γ5 concentration. Symbols and bars are mean ± SEM of three to five separate experiments. The continuous line represents the least-squares fit with the Hill equation (Eq. 3) and yields a Hill coefficient of 1.73 and an apparent k d of 1.09 nM. The predicted P o/P o4Gβγ ratio for a KACh channel with four gating modes arising from the binding of a different number of Gβγ subunits to four binding sites in the channel structure (Eqs. 1 and 2) is plotted for comparison as a dotted line.
