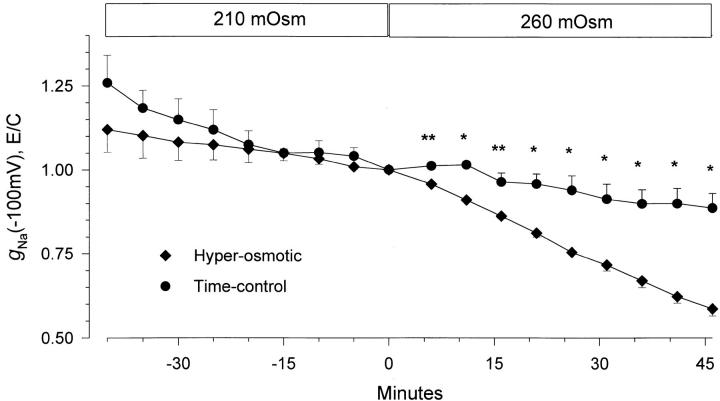
Figure 10.
Time-course of inhibition of amiloride-sensitive slope conductance after hyperosmotic cell shrinking. Data were corrected for the value of the amiloride-insensitive slope conductance as described in materials and methods and are plotted normalized to the conductance immediately before the hyperosmotic solution change. The time-control data were obtained from oocytes treated in a similar manner except that they were not incubated in the hyperosmotic solution. It is clear that a 25% increase of solution osmolarity caused a gradual decrease of ENaC conductance. This decrease of conductance was not observed in the time-control group. n = 6 and 7 for the hyperosmotic and time-control groups, respectively. *P < 0.001 and **P < 0.004 using a nonpaired Student's t test. All other data points were not significantly different from each other when compared between the two groups of oocytes at the same time interval.

