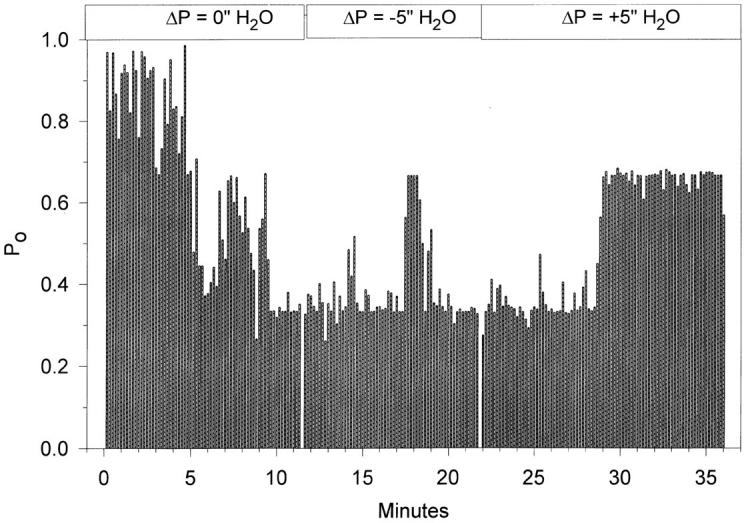
Figure 14.

Time course of the changes of the single channel open probability in response to changes of pipette pressure. Open probability data were binned into 10-s intervals and were plotted as a continuous function of time. Despite the noticeable spontaneous changes of P o that were observed in the control period (0 in. ΔP) and toward the end of the experiment (+5 in. ΔP), there were no changes between the control period and each of the experimental periods, indicating lack of sensitivity of ENaC to either positive or negative pipette pressure difference.
