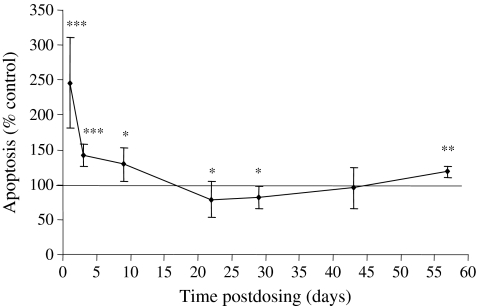
Figure 5.
Apoptosis in the femoral bone marrow cells of mice treated with azathioprine (AZA) (100 mg/kg) and autopsied on days 1, 3, 9, 22, 29, 43 and 57 postdosing. Values are means ± SD expressed as a percentage of the concurrent control mean value. The number of animals in the control and AZA-treated groups are set out in Table 4; *significantly different from control animals, P < 0.05; **P < 0.01; ***P < 0.001.

