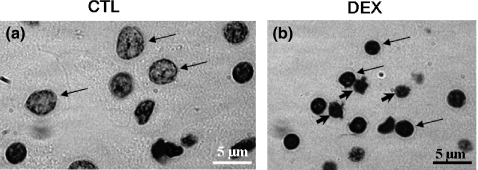
Figure 3.
Nucleus of isolated islets stained by Feulgen's DNA method. Nuclei from CTL (a – arrows) and DEX (b – arrows) islet cells. Occasionally, pyknosis signals and bleb formation indicate the presence of suspect apoptotic phenotypes in DEX islet cells (b – arrowheads). See text for details of morphometrical data. Magnification ×1000.

