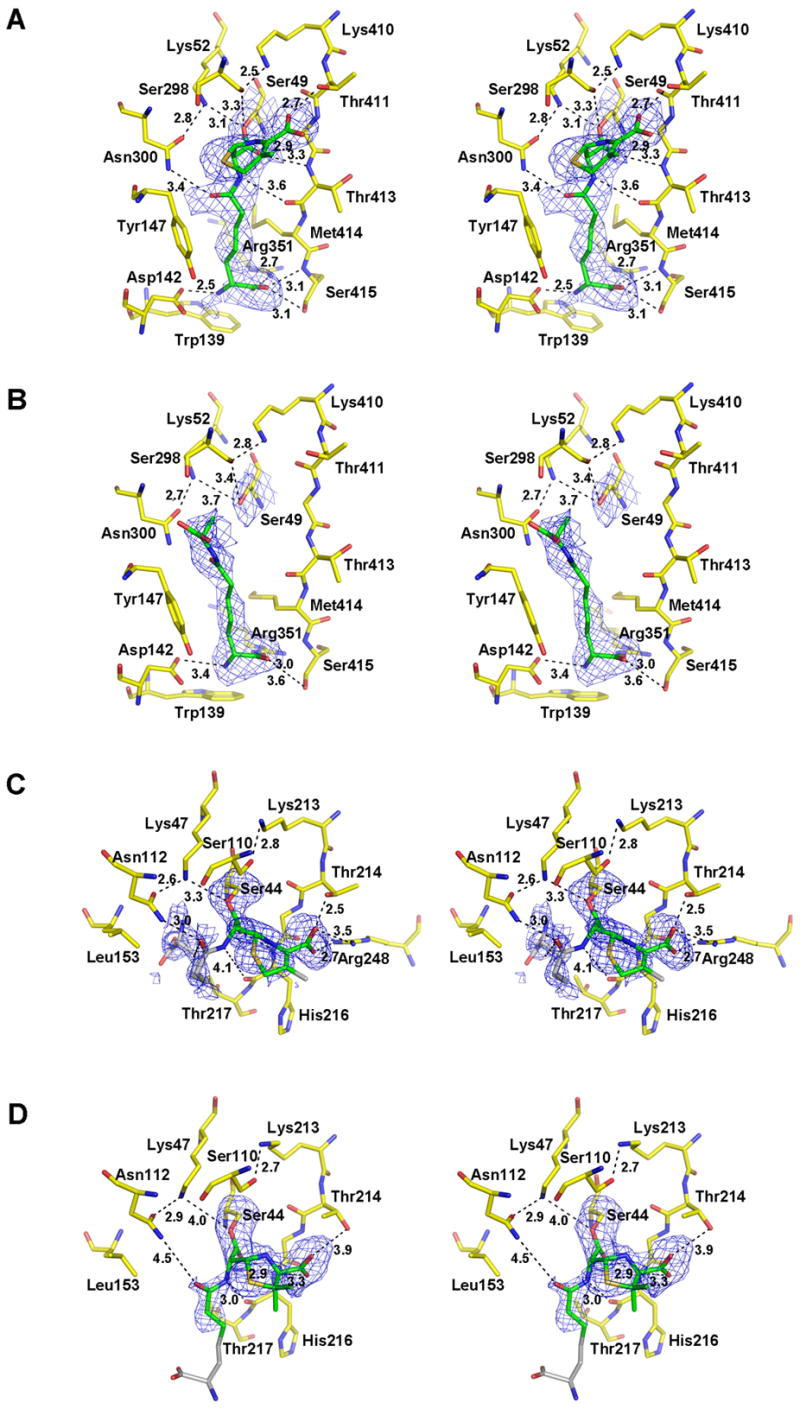
Figure 1.

Crystal structures of the R39 DD-peptidase in complex with (A) the cephalosporin 6 and (B) the peptide 7, and of PBP5 from E. coli in complex with (C) the cephalosporin 6 and (D) the penicillin 5. In these stereoviews of the respective active sites, the electron density is a |Fo| − |Fc| difference map calculated from the final coordinates of each model refined in the absence of the ligand. The resulting positive density is shown in blue and is contoured at 2.0 σ Carbon atoms of each ligand that are visible in the electron density and have been included in the final model are colored green. Those that could not be modeled (in PBP 5) due to weak density are colored grey and are included to show the approximate positions of these groups. The carbon atoms of amino acids that form each active site are colored yellow. Oxygen atoms are colored red, nitrogen blue, and sulfur orange. Potential hydrogen bonds are shown as dashed lines and the distances are noted in Å. Some distances beyond hydrogen bonding range are shown in D to compare with the equivalent distances in C. This figure was generated using PYMOL (pymol.sourceforge.net).
