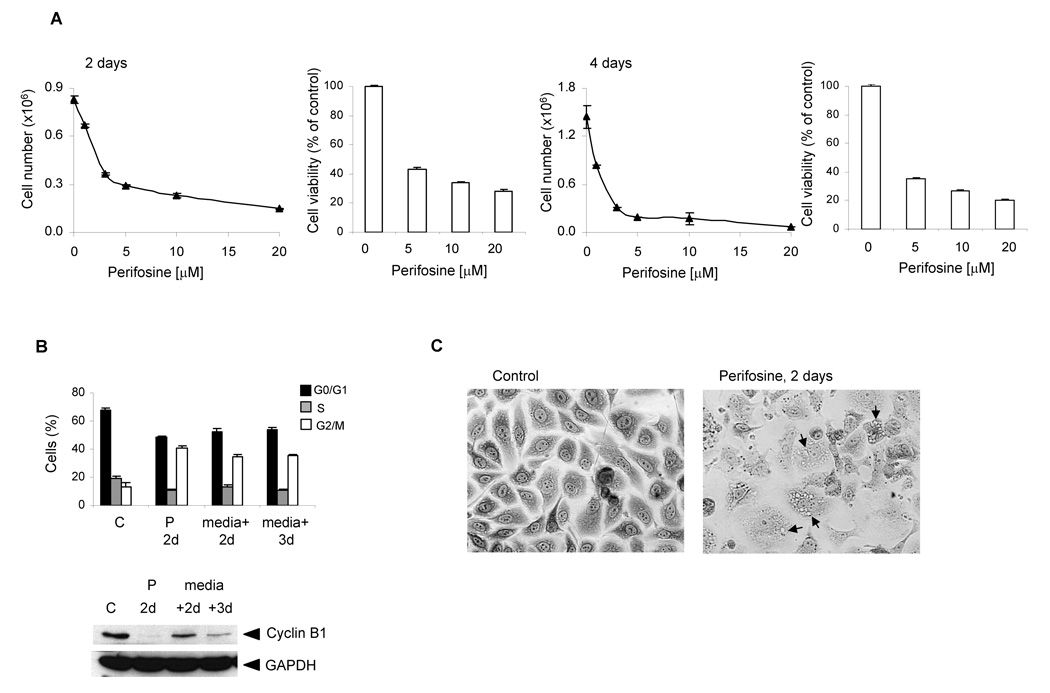
Figure 1. Perifosine-induced cell growth arrest and reduced viability (A), cell cycle block (B) and morphological changes (C).
A, A day after cells were seeded at 3 × 10⁵ per well in 6-well plate in triplicates, they were incubated for 2 and 4 days with 1, 3, 5, 10 and 20 µM perifosine. To analyze cell viability, cells were seeded at 5 × 10⁴ per well in 12-well plate in triplicates. Cell viability was measured by MTS proliferation assay as described in Material and Methods at indicated times. Bars, SD. B, For the cell cycle analysis, cells were seeded at 1 × 10⁶ per 10 cm plate in triplicates and incubated with 5 µM perifosine for 2 days. Treated cells were further incubated for 2 and 3 days without the presence of perifosine. Columns, percentage of cells; bars, SD. The protein levels of cyclin B1 were analyzed by western blotting as described in Material and Methods. The experiments were repeated three times and typical results are presented. P 2d, perifosine treatment for 2 days; (medium + 2d), cells without perifosine for 2 days; (medium + 3d), cells without perifosine for 3 days. C, A day after seeding PC-3 cells at 3 × 10⁵ per well in 6-well, they were treated with 5 µM perifosine for 2 days. At the end of treatment, cells stained with Giemsa solution and photographed (x10 magnification). Arrows indicate cytoplasmic vacuoles.

