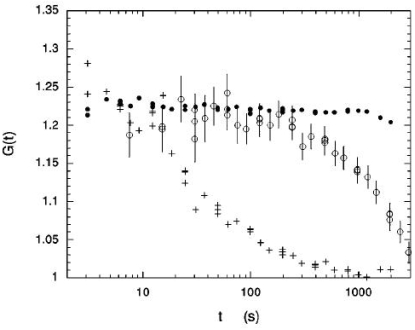
Figure 14.
Correlations observed at  Å−1 with three samples: a ‘liquid’ (crosses), with a short fluctuation time, a ‘thixotropic’ sample (open circles) exhibiting long-time fluctuations and a static aerogel (closed circles) for a test of the experimental stability. From Geissler et al. (2000 ▶).

