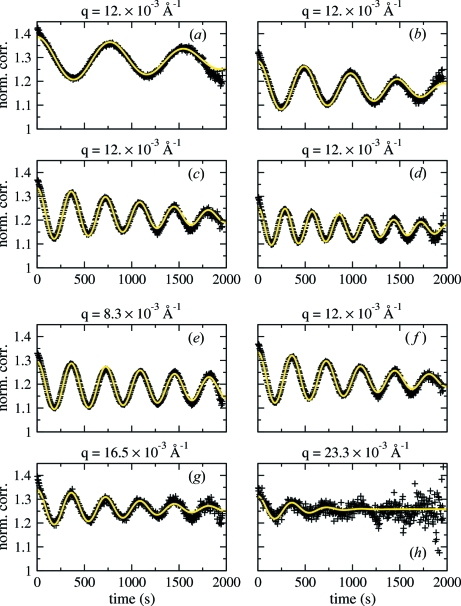
Figure 15.
Heterodyne correlations obtained from the CL-EPR sample. (a)–(d) Various values of the  projections [
 0.569, 0.899, 1.21 and 1.52
 Å−1] along
  for
for  Å−1. (e)–(h) Various q values for
  Å−1 showing the identical period of the oscillations. Continuous curves correspond to fits with equation (26). From Livet et al. (2006 ▶).

