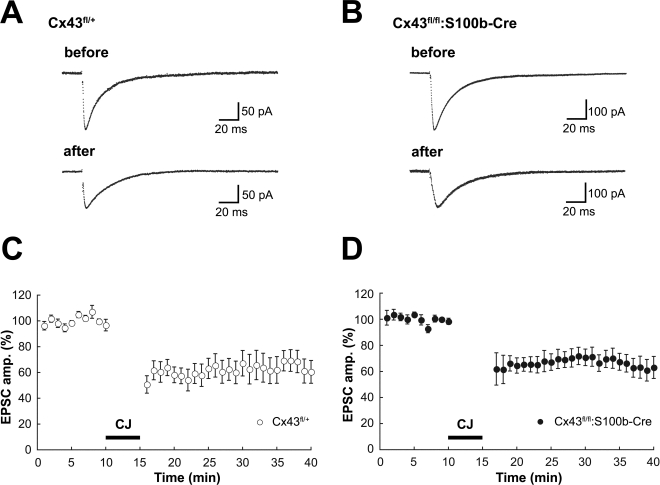
Figure 9.
Basal PF-PC EPSC and LTD induction in control (Cx43fl/+) and Cx43fl/fl:S100b-Cre mice. (A, B) A representative example of PF-EPSC before and after conjunctive stimulation in Cx43fl/+ (A) and Cx43fl/fl:S100b-Cre (B) mice. Six records are averaged. (C, D) PF-EPSC amplitude was plotted against time before and after conjunctive stimulation averaged for 8 cells from 8 Cx43fl/+ mice (C) or for 9 cells from 8 Cx43fl/fl:S100b-Cre mice (D). Each point represents the average of three successive responses acquired at 0.05 Hz for every minute. Bar indicates the period of conjunctive stimulation (CJ).

