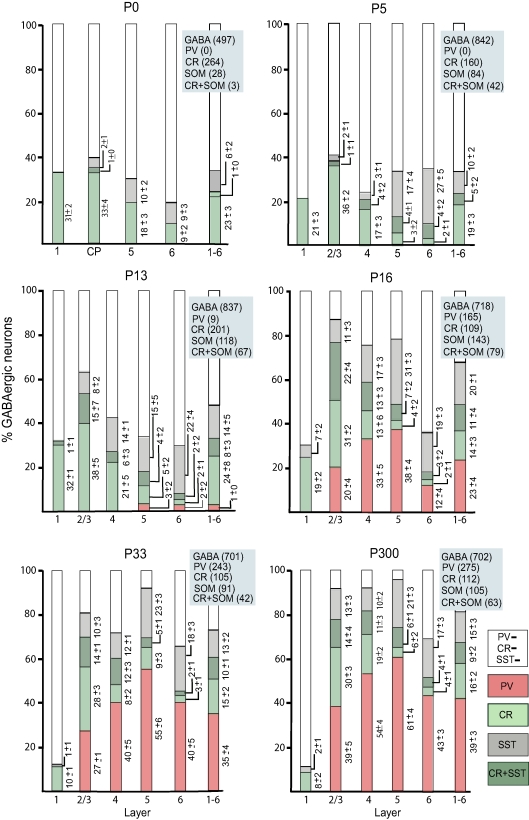
Figure 7.
Percentage of PV, CR, SOM and CR + SOM neurons in population of GABAergic neurons across postnatal development of mouse visual cortex. Columns represent percentages of CR, SOM, PV and CR + SOM immunolabeled neurons in the total population of GABAergic neurons in different layers and at different postnatal ages. Numbers represent mean ± SEM percentages of each cell type in the population of GABAergic neurons across different sections and animals. The blue boxes contain the total number of cells counted for each marker. CP: cortical plate.

