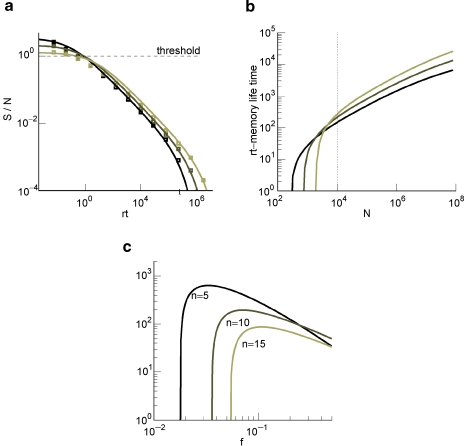
Figure 3.
(a) of cascade (solid curves are the fits of Equation (2) and the squares are obtained from the mean-field calculation) with n = 10 at N = 104 and decreasing values of f = 0.19, 0.11, 0.07 (lighter lines). (b) rt at which the ratio of Equation (2) goes below 1. Same f s as in (a). The dotted line corresponds to the 104 synapses. (c) Memory lifetime as a function of f for N = 104 and for n = 5, 10, 15 (light lines correspond to increasing values of n).

